
How to Set up a Relational Report in Management Reporter
By now you are probably familiar with the basics to Management Reporter. You can create and print various reports, such as Income Statements and Balance Sheets.
However, if you’re looking to elevate your reports and impress others with your design skills, consider using Relational Report.
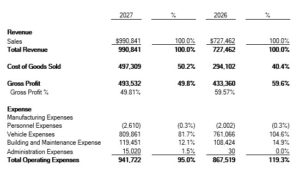
The third and last columns show your amounts relative to grand totals. As an example, you could see what your Vehicle Expenses are relative to your total expenses, or perhaps even total revenues. As a user of this report, you would find this especially valuable when comparing percentages from one year to another. If you see that your Vehicle Expenses are increasing significantly as a percentage to total expenses, you may want to dig into why that is.
In order to create these rows, you need to take 2 steps.
Row Definition
Go to your row definition of the report you want to change.
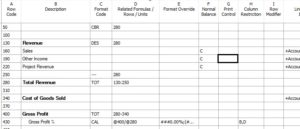
Find the row where you would like the percentages to start, and right above that, insert a blank row, and type in the Format Code CBR (Change Base Row) under column C.
Then, under Related Formulas / Rows / Units under column D, type in the row that the amounts should be divided into. As an example, the screenshot below references row 280, which is the Total Revenue. Therefore, all amounts should show as a percentage of total revenue.
Column Definition
Now you need to indicate where the columns with the percentage calculations should show up. You could have just one, or you could have multiple columns calculating based on different periods.
Insert a column where you would like the percentage calculation to show. Ideally, the column would be beside the other column with the dollar values.
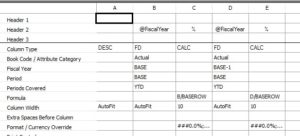
Under Column Type, type in CALC.
Then, under the Formula, type in the row with the dollar values that you are using for calculations and divide that by the term BASEROW. That baserow is referring to the row you defined under the row definition. Recall the CBR, with the row number beside it.
You can repeat the process if you want more than one percentage column. Once you are done, you can save and close your column definition.
Put it All Together
Now you have the Row Definition, and the Column Definition complete. Go to your Report Definition and generate your report.